
Investment Price Montoring Tools For Linux Lite Diamond 4.x
Part Two: Data Visualization
A Few Comments
As we continue with this series of tutorials, what we are aiming for here is finding a quickly loading group of charting tools that can be automated to run from one BASH command and display ready made charts for our retrieved API data along with whatever charts and graphs we choose to make with LibreOffice Calc. There are of course many beautiful proprietary applications that can accomplish such a goal, but it is our stated purpose here to show Linux Lite 4.x series users how to adequately automate such tools for their own use using free software from the correct Ubuntu repositories. I would be remiss not to mention the many free scientific charting and graphing tools available to Linux users besides LibreOffice Calc, such as Kst in the KDE repositories and Labplot in the Debian repositories. See the link below for the many Linux tools available. I have personally found Kst in particular to be an excellent tool, but it actually does not suit our purpose here, and it is also substantially more than we really need to accomplish what we want to do.
https://blends.debian.org/science/tasks/viewing.de.html
Financial data visualization software is a profitable business in itself, and you will find that such fully integrated Linux software will cost you just as much or more than comparable MS or Mac software. I have researched this thoroughly and found a couple of things to be true of financial software in general. Free software designed for crypto-currency is plentiful, as are its free APIs. There are several decent terminal charting applications in both ruby and npm for following and charting bitcoins. Free charting software geared to the US stock markets is as rare as its APIs, and generally people tend to use the free web and cloud applications instead, and in fact most of the ruby or npm applications available were written for use with the no longer free Yahoo and Google Finance APIs. As I said in the first half of this tutorial, it just makes a lot more sense to be prepared for APIs coming and going by being set up with a simple set of wget scripts. This also applies to stock charting software in a lot of cases, not to mention that UIs in some cases are coarse and drab compared to Linux Lite’s beautiful desktop. All that said, I believe what we are about to do here fits well with the Linux Lite mission of being a “simple fast free” operating system.
1) Preparation
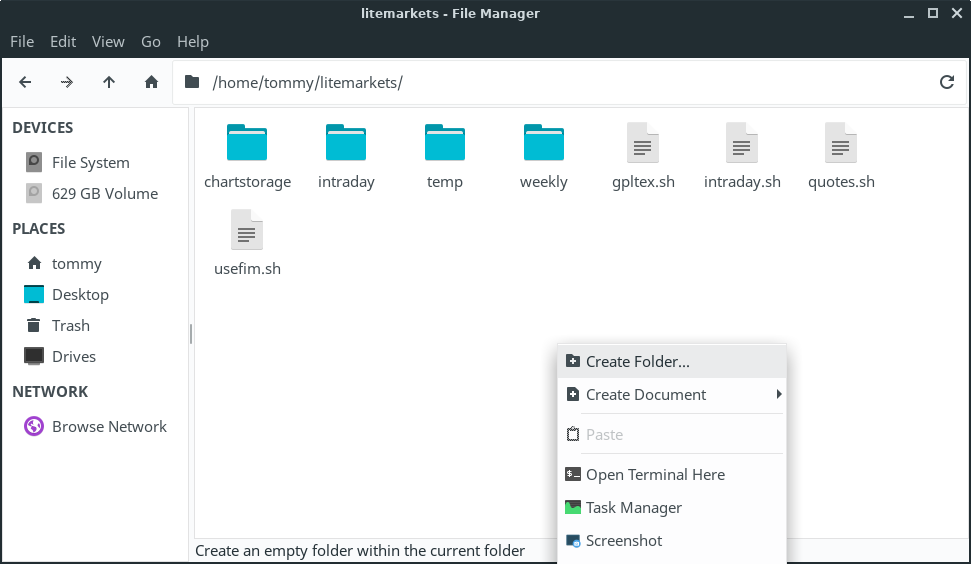
Continuing on from our previous tutorial open Thunar (home folder icon on your Linux Lite 4.x XFCE desktop) and open up the litemarkets folder we created in the previous tutorial which should contain folders labeled intraday and temp and two script files, intraday.sh and quotes.sh. We will add two more folders and two more script files. Right click on an empty space in Thunar select create folder and add the two folders named chartstorage and weekly. See image below.
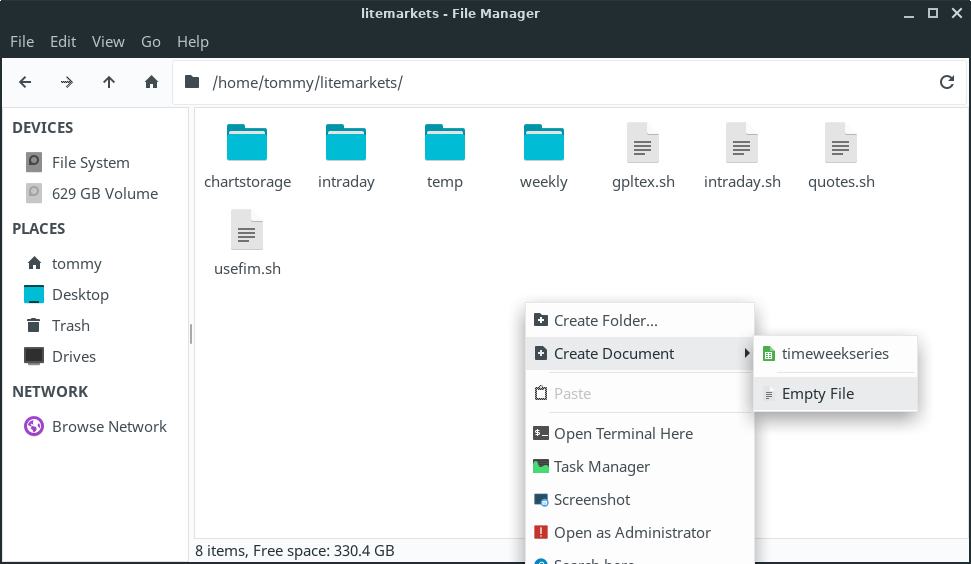
Next right click again on a blank space and select create document and empty file and add the two new files gpltex.sh and usefim.sh. We will write a couple new scripts in them to complete our automation. See image below.
2) Software Installation
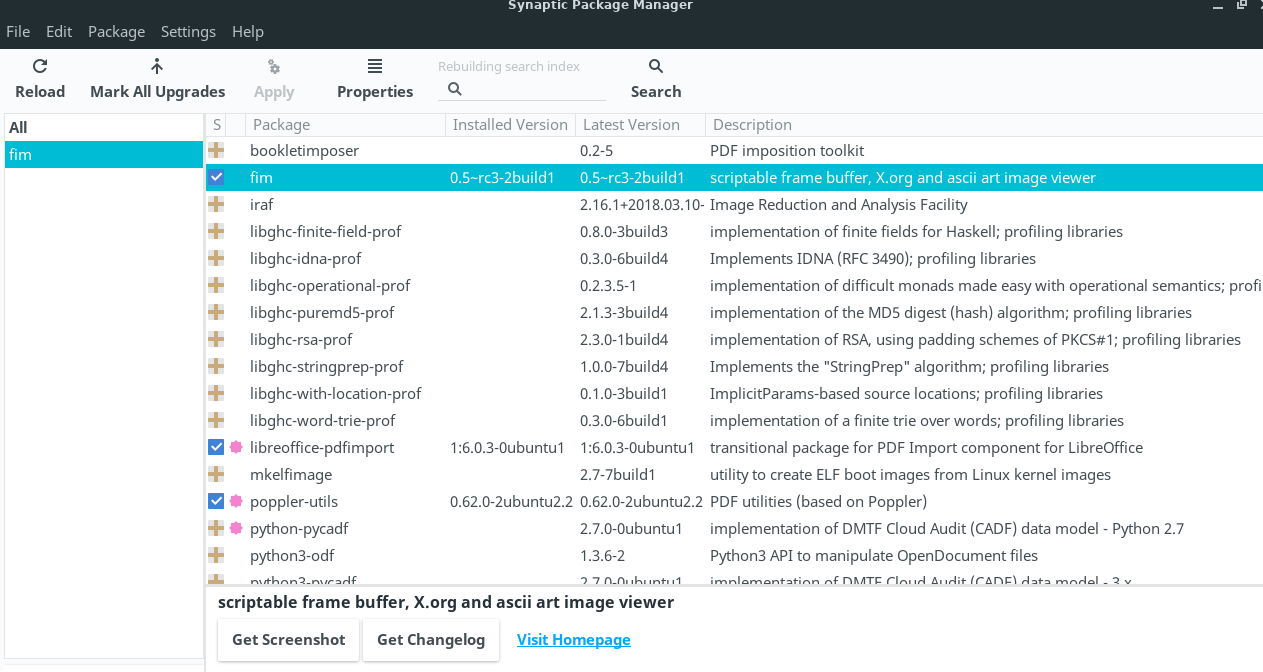
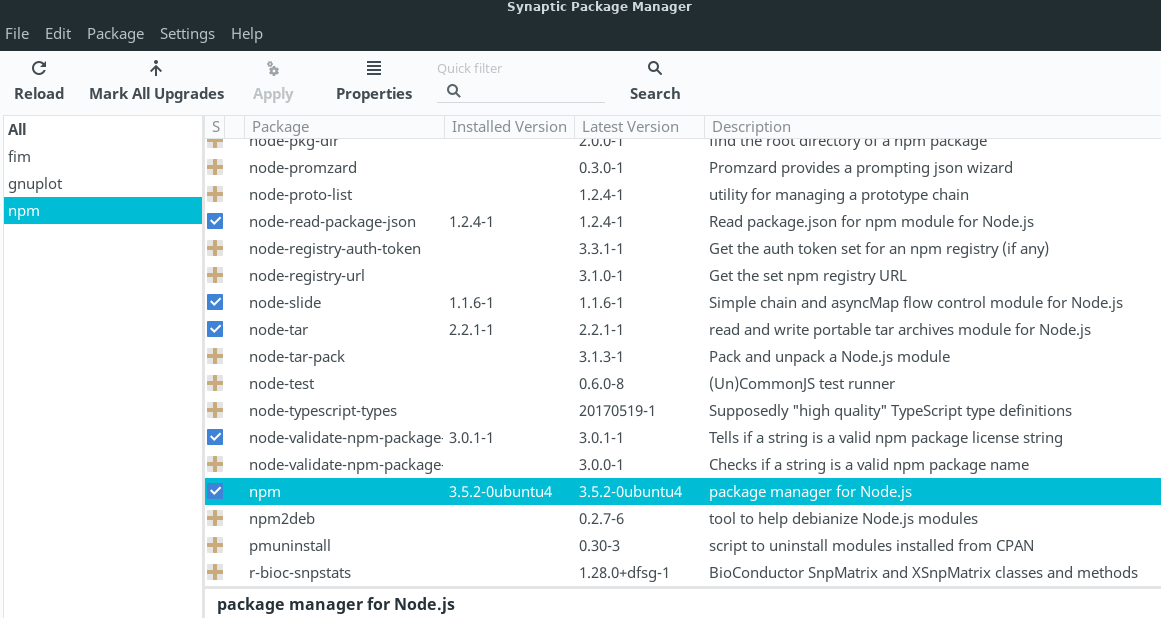
Now we need to install three new applications. Open Menu>System>Install/Remove Software (Synaptic) from your Linux Lite desktop. Type fim into the search box, mark it for installation, click apply and install it. See image below.
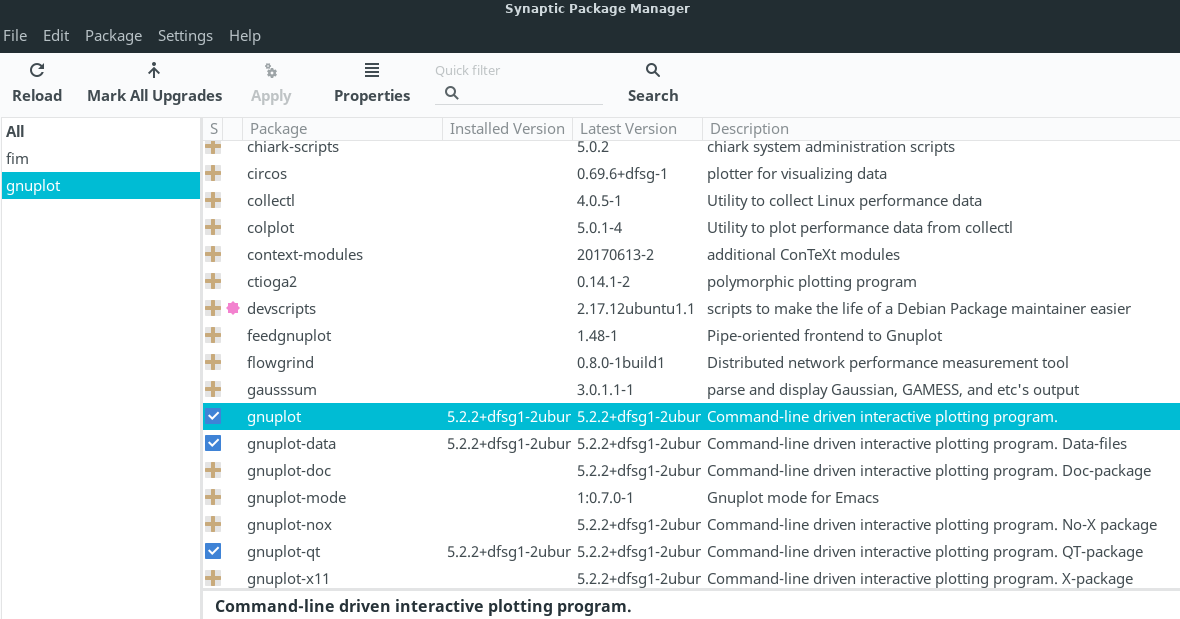
Next type gnuplot into the search box, mark it for installation, agree to all its dependencies, click apply and install it. See image below.
This next piece of software is a node.js application and is optional, and we are only installing it to run a CLI graphing application for tracking and graphing crypto-currency prices in the terminal. We could use wget and gnuplot to accomplish this as well, but given the number of free APIs available for tracking crypto-currency, plus the fact that I have tested this application, and the amount of work to script gnuplot and its shell escapes, and add that information to this tutorial, I have just decided to include it as a quick solution. Automating the tracking and graphing/charting of stock prices and volumes in a universal and adaptable way is necessary in my opinion, but that is not the case for crypto-currency. Maybe by next year sometime I can produce a complete ruby application that encompasses the kind of usage we want for wget and gnuplot, but for now we will stick with BASH scripts. So… for now, let’s just type npm into the search box, mark it for installation, click apply, and install the node.js package manager to our system. **Again you can skip this part of the tutorial altogether if you like, but we’ll go ahead and do it. After npm installs logout and restart your computer. See image below.
After your computer restarts open your Linux Lite XFCE terminal and type the command below at the prompt.
npm install bitcoin-chart-cli -g
Once the application completes installation type the command below at the prompt.
bitcoin-chart-cli –help
A screen like the image below should appear in your terminal.
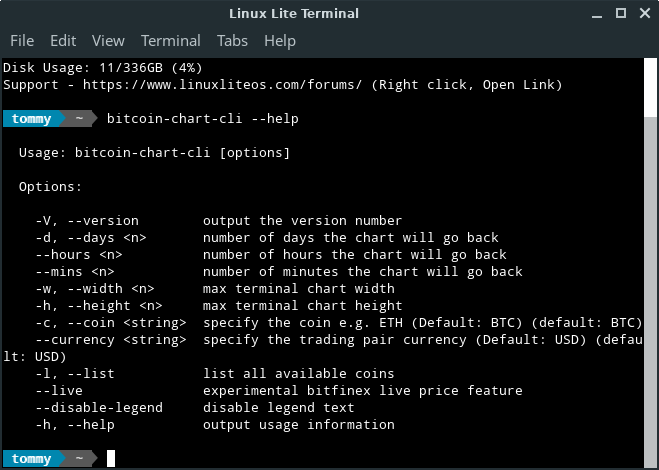
From this help screen we can discern the command line we will later add to our existing automating script (prices.sh), and we can see that the default currency pair is bitcoin and US dollars. We will use the command: bitcoin-chart-cli -d 30 -c LTC. This will generate a 30 day line chart of LiteCoin prices. Below is the link to the website for this application.
https://github.com/madnight/bitcoin-chart-cli
** Again this step is optional. Find your quotes.sh script file in your ~/litemarkets folder, and open it with Linux Lite’s simple text editor. Find the last line, which should be: coinpare markets LTC. Enter the lines shown below here directly below it.
figlet -f small “Chart LiteCoin Price$”
bitcoin-chart-cli -d 30 -c LTC
Save the file and close the text editor.
3) Automating Gnuplot & Fim
Gnuplot is controlled from a UNIX shell, and because we are writing BASH scripts to automate it we will need to utilize both an EOF limiter and a second script within our script to cleanly exit its Unix shell and return to our BASH prompt once our graph/s is plotted. This will also allow us to add EOF limited graph scripts (plot more than one kind of graph from BASH, from more than one data file/s) one after the other in the future and then run our exit script. While we’re at it we might as well write a separate fim startup script as well. This will allow us at any later date to edit the many fim options to suit our needs without changing our basic automation script, such as using more than one storage folder, slideshow, and viewing graphs we have created with applications other than gnuplot.
Okay. Let’s open up the empty file we created – gpltex.sh in our ~/litemarkets folder with Linux Lite’s simple text editor. Enter the two lines shown below, save the file, and close text editor.
#!/bin/bash
gnuplot exit
Next open your terminal and type chmod +x ~/litemarkets/gpltex.sh and hit enter to make the script executable from BASH.
Okay. Now let’s open up the empty file we created – usefim.sh in our ~/litemarkets folder with our simple text editor again, and enter the two lines shown below, save the file, and close the text editor.
#!/bin/bash
fim -R ~/litemarkets/chartstorage/
Next open your terminal again and type chmod +x ~/litemarkets/usefim.sh and hit enter to make this script executable from BASH. Logout and back in again.
Now we are ready to finish our automating script. Open up the quotes.sh file located in your ~/litemarkets folder with Linux Lite’s simple text editor set to full screen. Find the line bitcoin-chart-cli -d 30 -c LTC if you decided to add it, or the line coinpare markets LTC if you did not install bitcoin-chart-cli. One the next line below it enter the lines as shown below.
figlet -f small “Charts US Stock$”
figlet -f term “**see fim window**”
Just below these two we need to add our long wget line that obtains our weekly price data form the AlphaVantage API. Remember to substitute your real user name for yourusername, and your 16 character API key for demo, and any stock symbol you like for FB (Facebook) the stock we are tracking in this example.
wget -q -P /home/yourusername/litemarkets/temp/ “https://www.alphavantage.co/query?function=TIME_SERIES_WEEKLY_ADJUSTED&symbol=FB&apikey=demo&datatype=csv”
I have used a smaller font so you can hopefully see in your browser that this command is one long line of code. Next just enter all the lines shown below in order, substituting your real user name for yourusername when necessary.
mv /home/yourusername/litemarkets/temp/* /home/yourusername/litemarkets/weekly/weekly.dat
gnuplot <<- EOF
set terminal png
set output “~/litemarkets/chartstorage/fbcswk1.png”
set title ‘FaceBook 12 Weeks Current’
set xdata time
set timefmt”%Y-%m-%d”
set xrange [“2018-06-22”:”2018-09-07”]
set yrange [*:*]
set datafile separator “,”
plot ‘~/litemarkets/weekly/weekly.dat’ using 1:2:4:3:5 notitle with candlesticks
EOF
./litemarkets/gpltex.sh
./litemarkets/usefim.sh
figlet -f term “”
Click >File and then click >Save from the dropdown menu to save your script file, and then close your text editor.
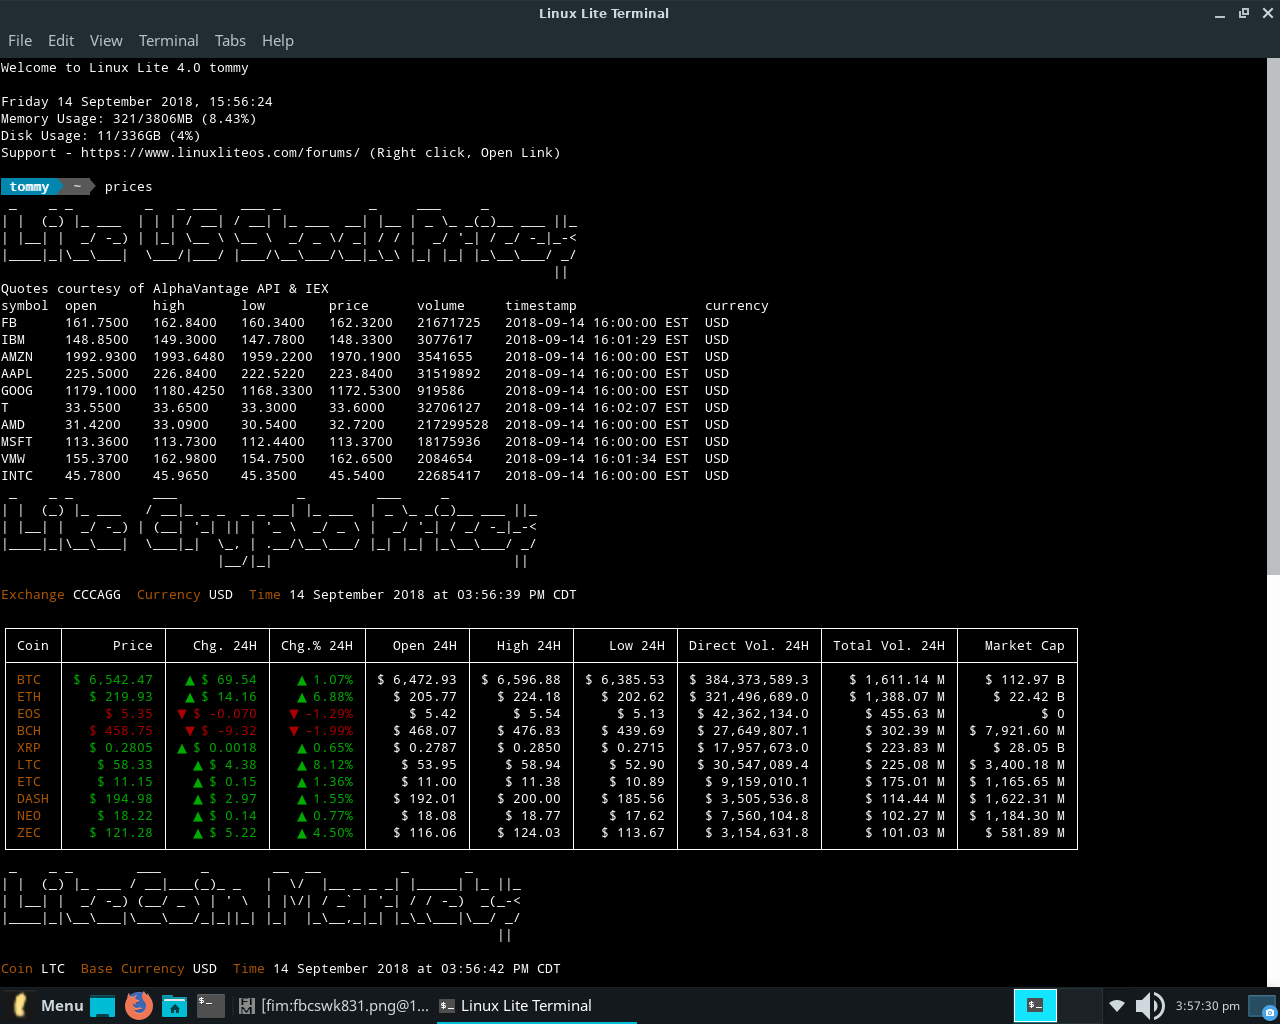
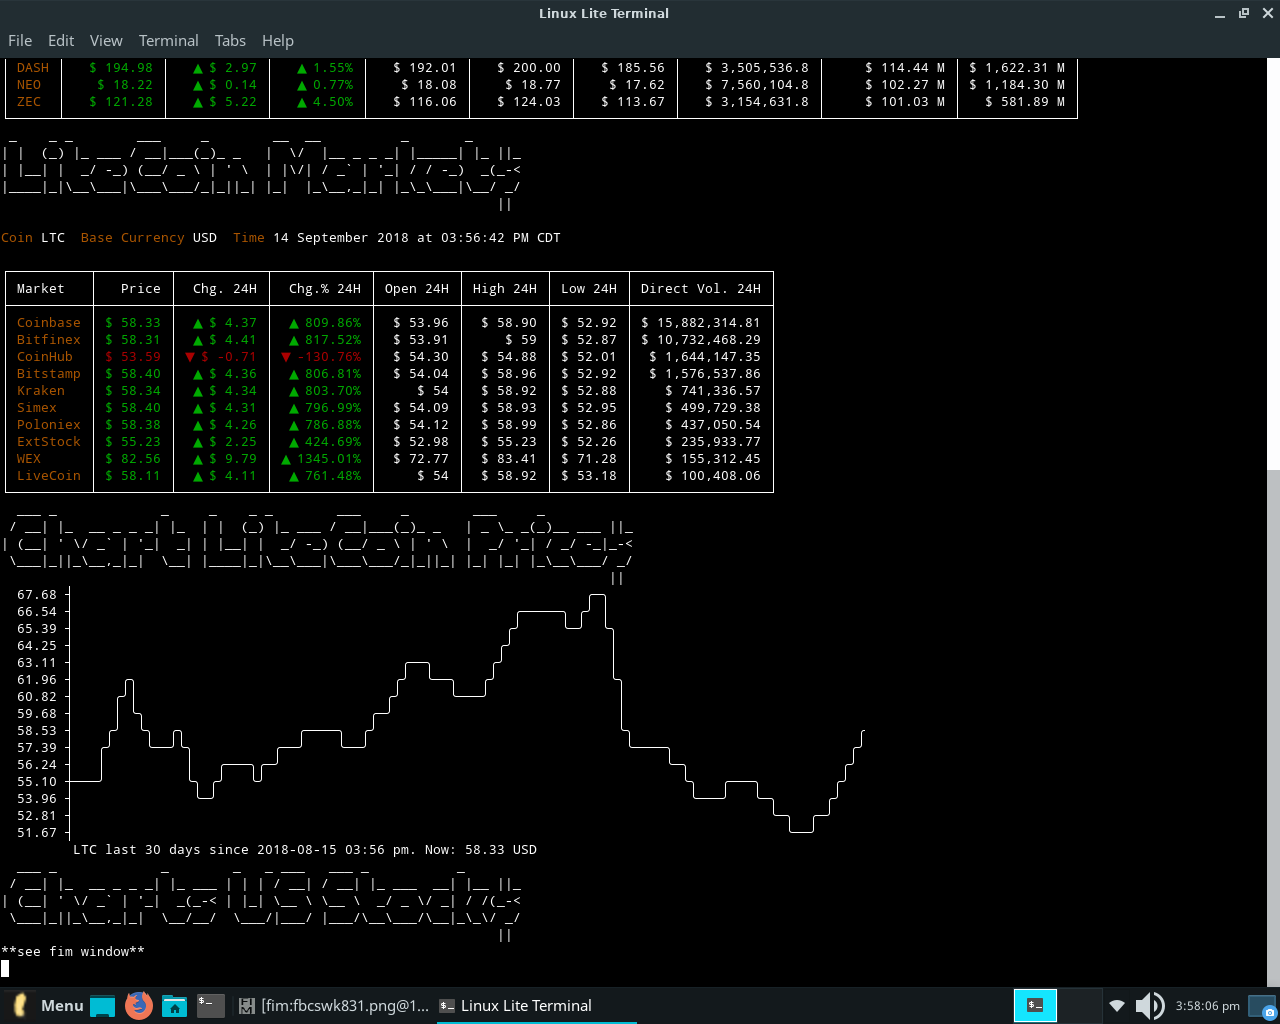
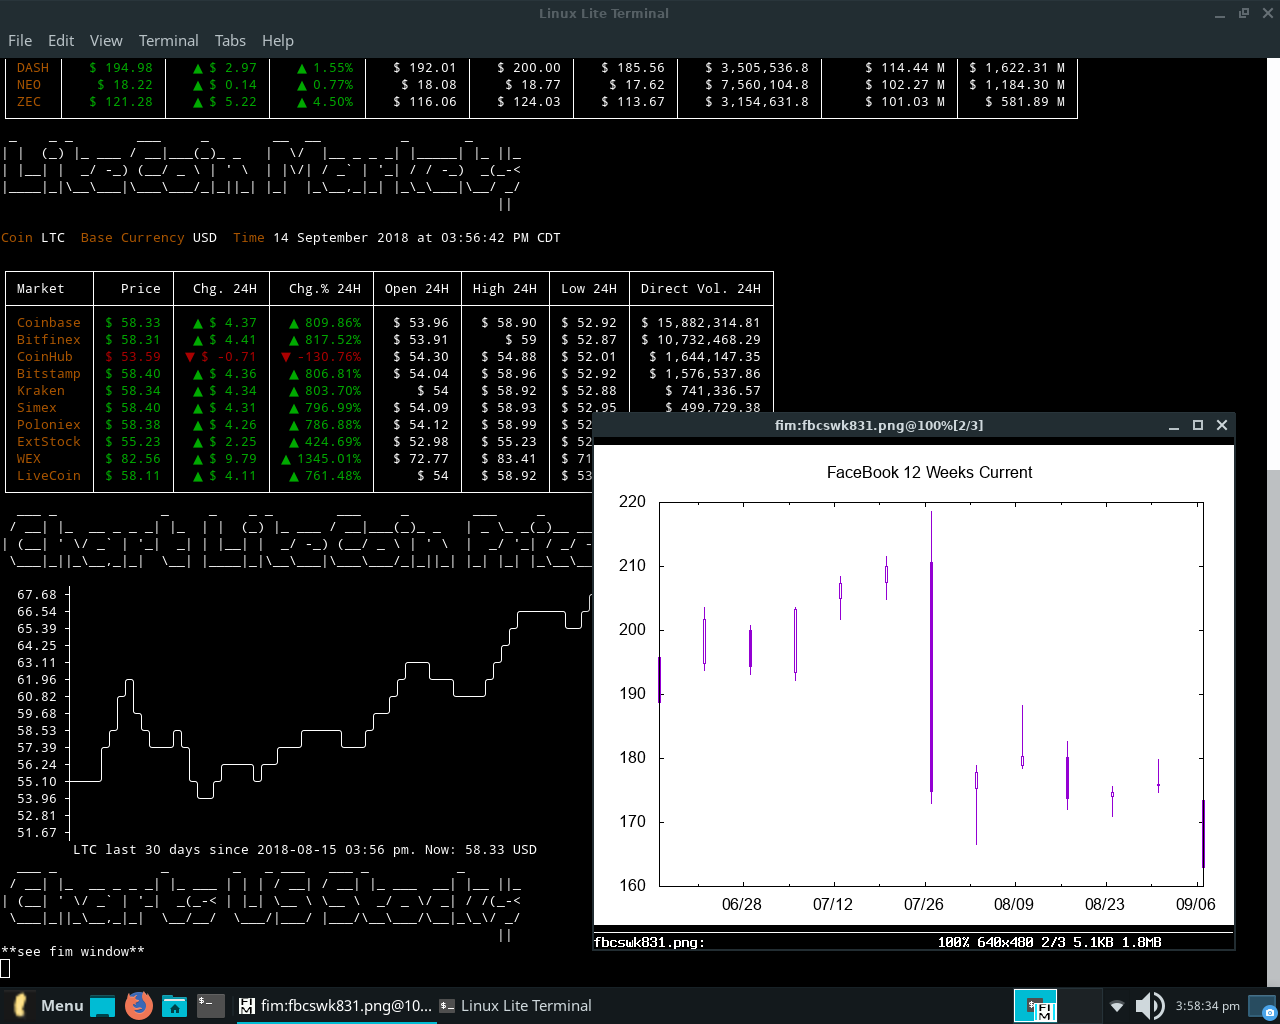
Open a terminal, toggle it to full screen, and type prices at the prompt, hit enter and the results should look like the images below, all loading within 10 seconds or so and returning immediately to the BASH prompt simply by closing the fim window.
The link below is to a demonstration video.
There is a method to this kind of madness. What we have done is create a unique way of utilizing gnuplot with BASH. Gnuplot can plot just about anything, and the AlphaVantage API can be reached with wget to provide all kinds of data to plot. Fim can be customized to handle files in multiple ways. Once we have configured any graphing function for gnuplot, and even continue to add new functions, as long as it all works, it becomes considerably easier to produce a complete ruby control file around an already functional method, even a dashboard to control all the BASH commands. Below are links to the considerable information available on gnuplot and fim.
http://www.gnuplot.info/docs_5.2/Gnuplot_5.2.pdf
https://www.nongnu.org/fbi-improved/
http://savannah.nongnu.org/projects/fbi-improved/
TO DO LIST
What follows below is a basic fine tuning to do list. I do welcome suggestions for BASH scripting solutions.
1) *Configure the dates that plot the xrange to be tied to the system time and correct themselves according to the apropos week.
2) *Configure the file mv command to include a variable that time-stamps the resulting .dat file.
3) *Configure the plot /weekly/weekly.dat command to include a variable that only opens the newest file according to a time-stamp.
4) *Rename the fim window title without compiling from source. (xdotool does not seem to work)
5) *Solve the Linux Lite system sounds issue when starting LibreOffice Calc from BASH.
6) *I am interested in any charting macros for LibreOffice Calc charting tools. Chart templates for Calc is a long neglected feature, probably because of gnuplot and the many other wonderful charting applications in the Linux world.
**This tutorial was prepared entirely with LibreOffice Writer/Web on Debian 9. All images are via the Linux Lite 4.0 screenshot tool.**