
Lite Markets 3
Lite Markets 3 is a Linux Lite series 5.x user friendly interactive .html coded interface designed to utilize financial data obtained from the Alpha Vantage API and IEX, and the charting capabilities of gnuplot to monitor the US Stock Markets and available technical indicators. You will need to install gnuplot to your Linux Lite 5.x system first and download Lite Markets 3 from here. Lite Markets 3 uses a set of simple BASH scripts (wget, column, awk, cut, rm, mv, cp, EOF) and gnuplot plots (linespoints, bar, candlesticks) to download, modify, and work with the data to produce clear user viewable results in a browser window without the tracking security risks and ad bloat of browser web access, and any cumbersome macro usage and modifications to LibreOffice Calc. All the scripts, plots, and page code are modifiable and reproducible to the point that a user could build an interface to monitor many stocks and many technical indicators with simple cut and paste operations in a text editor. The elements in the .html code page are designed for easy manipulation in the same way. This discussion will cover the simplest way to get the most out of the scripts and code provided in Lite Markets 3. The download is free and the scripts and code are yours to do with as you see fit.
Section 1) Getting The File Tree Correct (This page)
Section 2) How To Work With The Plots & Scripts
Section 3) How To Work With The Page Code
Get Your File Tree Right !
It is very important to get your file tree correct, as the scripts and plots are written to utilize it specifically. The simplest way to do so is to unzip the download directly in your home directory. Doing so will produce the correct file tree already containing data files and .png charts, and a dummy example.txt file in the temp folder. Study the images below for the correct file tree.
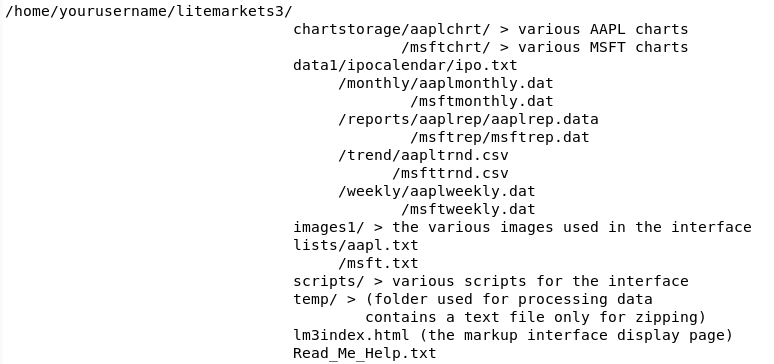
Below is the explanation from the Read_Me_Help file included in the download.
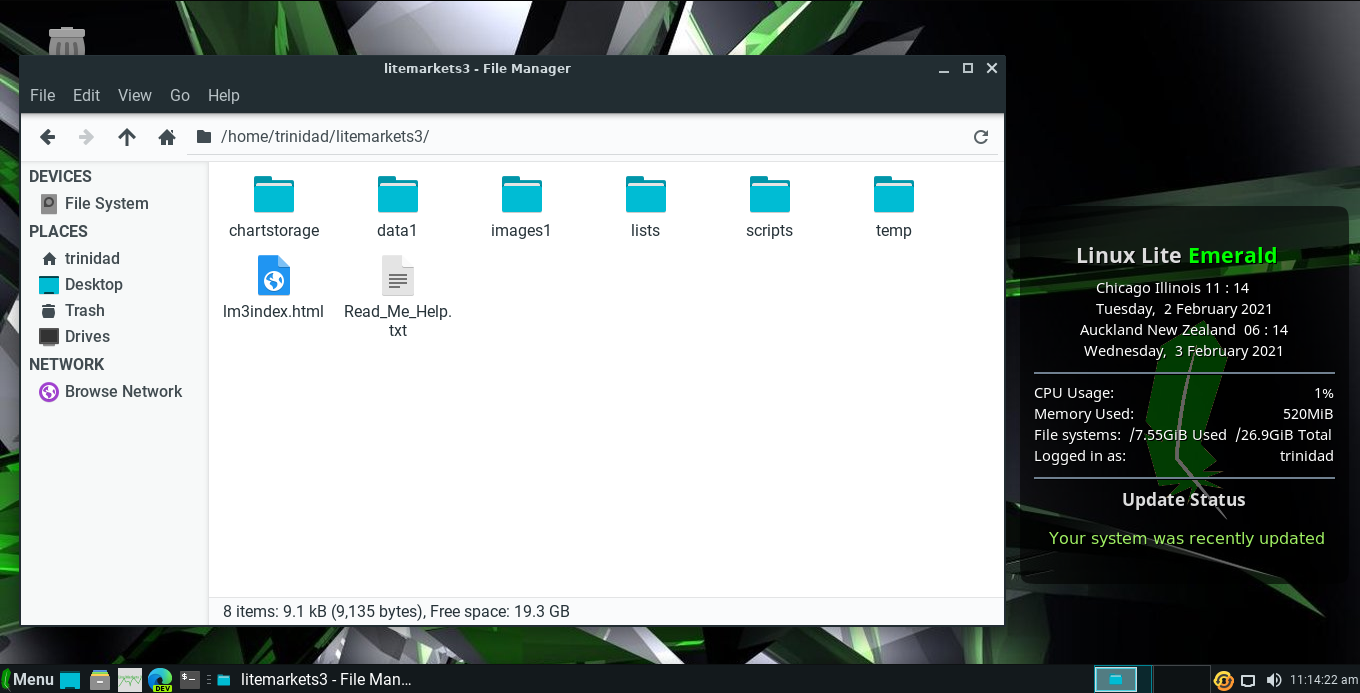
Below is an image of folders in your Lite Markets 3 folder in thunar in Linux Lite 5.x.
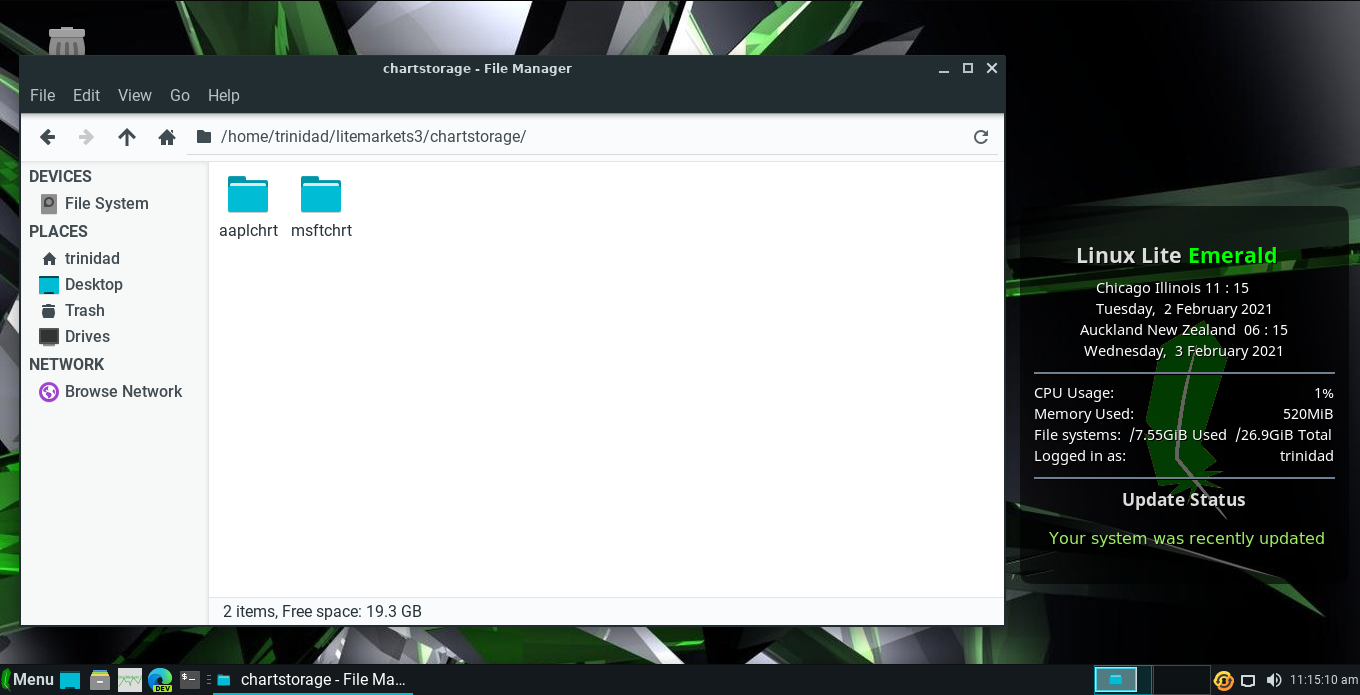
Below are the folders in the chartstorage folder. After you run all the scripts there will be a linespoints current prices chart, a bar current prices chart, a weekly candlestick chart, a weekly high/low linespoints chart, a monthly high/low linespoints chart, and a 4 trend lines linespoints chart in these respective folders for the applicable securities.
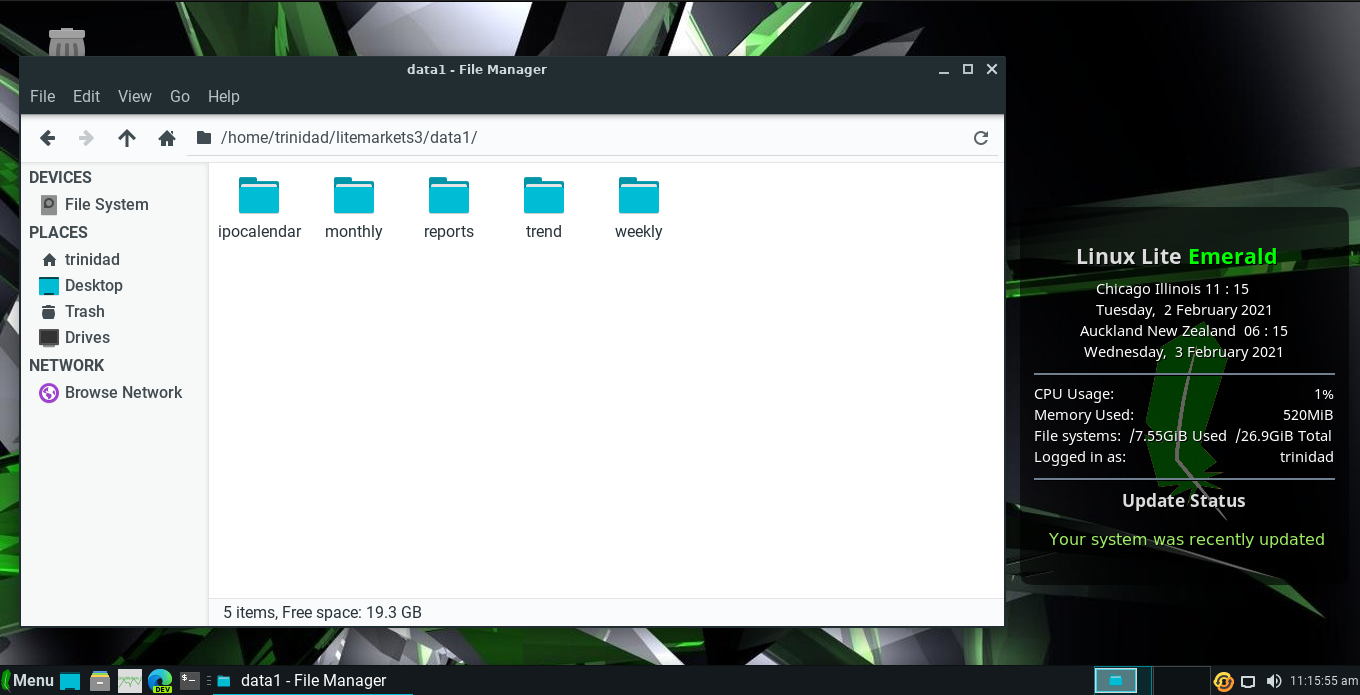
Below are the folders in the data1 folder. The ipocalendar contains the ipo.txt file. The monthly folder contains the aaplmonthly.dat and the msftmonthly.dat files. The reports folder contains the folders aaplrep and msftrep which contain the files aaplrep.dat and msftrep.dat files respectively. The trend folder contains the aapltrnd (1,2,3,4) .csv and the msfttrnd (1,2,3,4) .csv files. The weekly folder contains the aaplweekly.dat and the msftweekly.dat files.
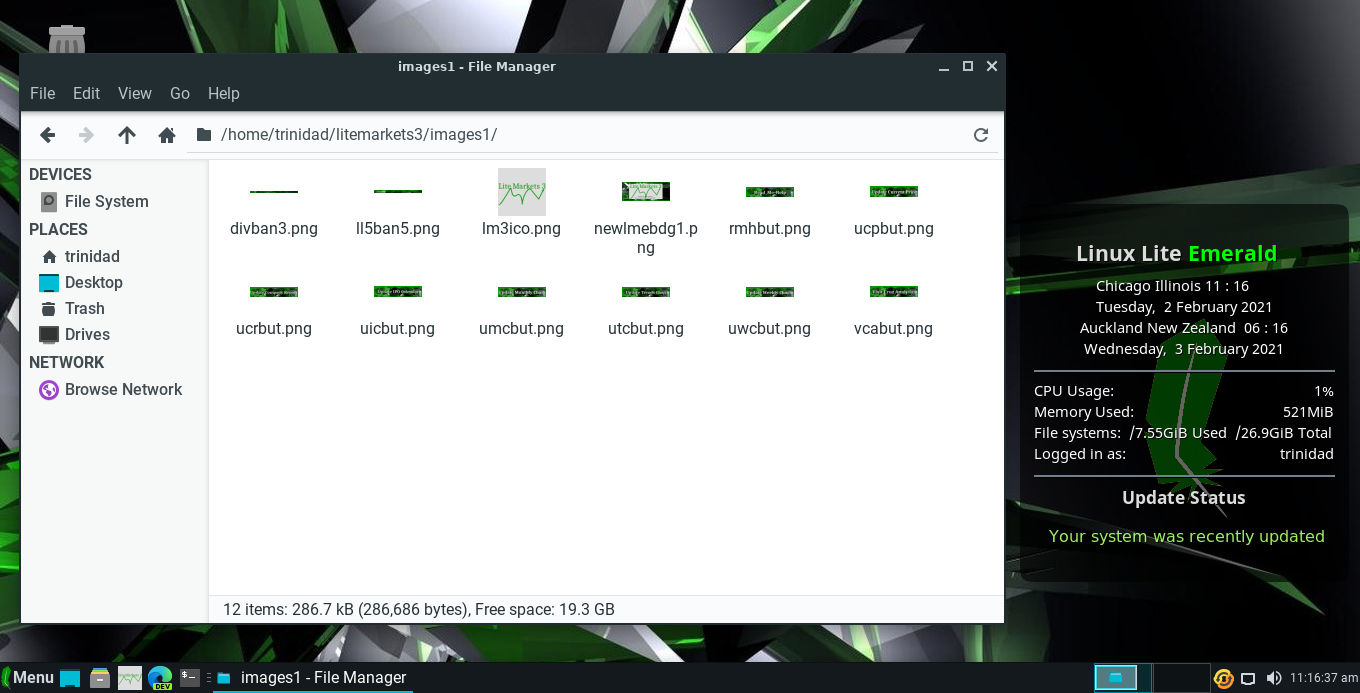
The images1 folder contains the images used by the markup interface and a Lite Markets 3 icon image for the XFCE launcher of Linux Lite 5.x.
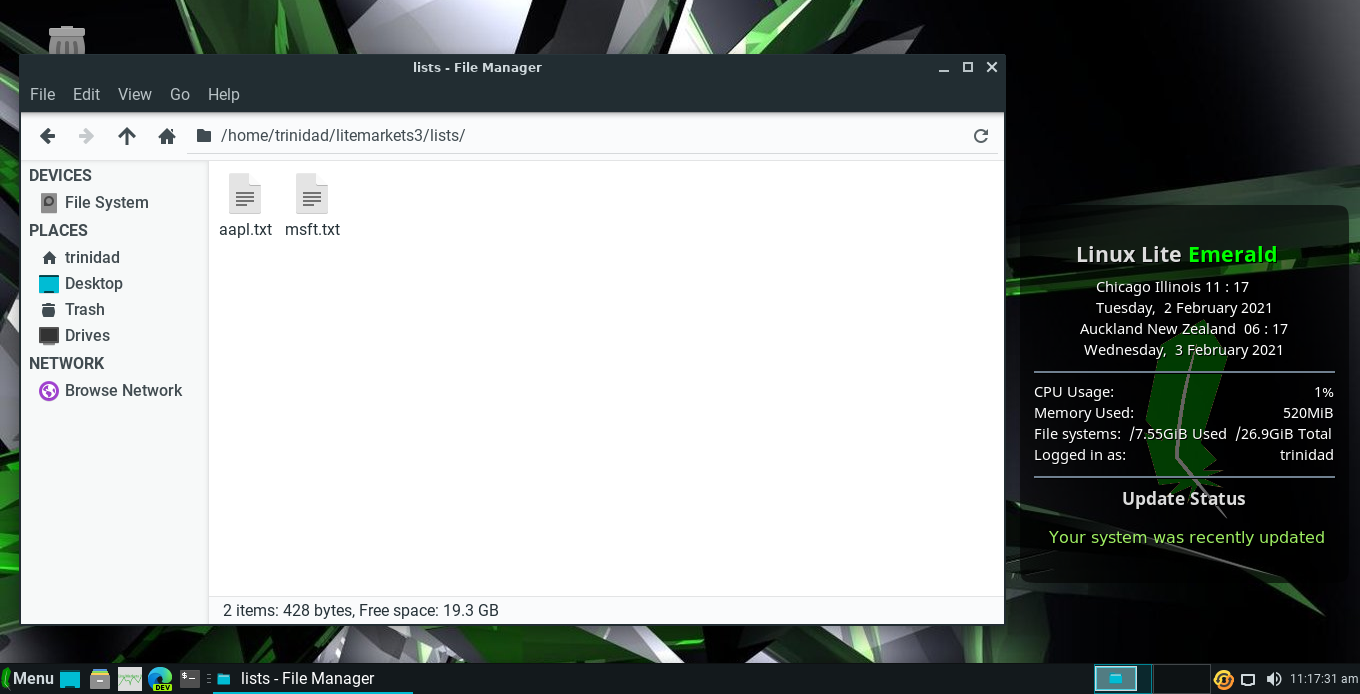
The lists folder contains the aapl.txt and the msft.txt files.
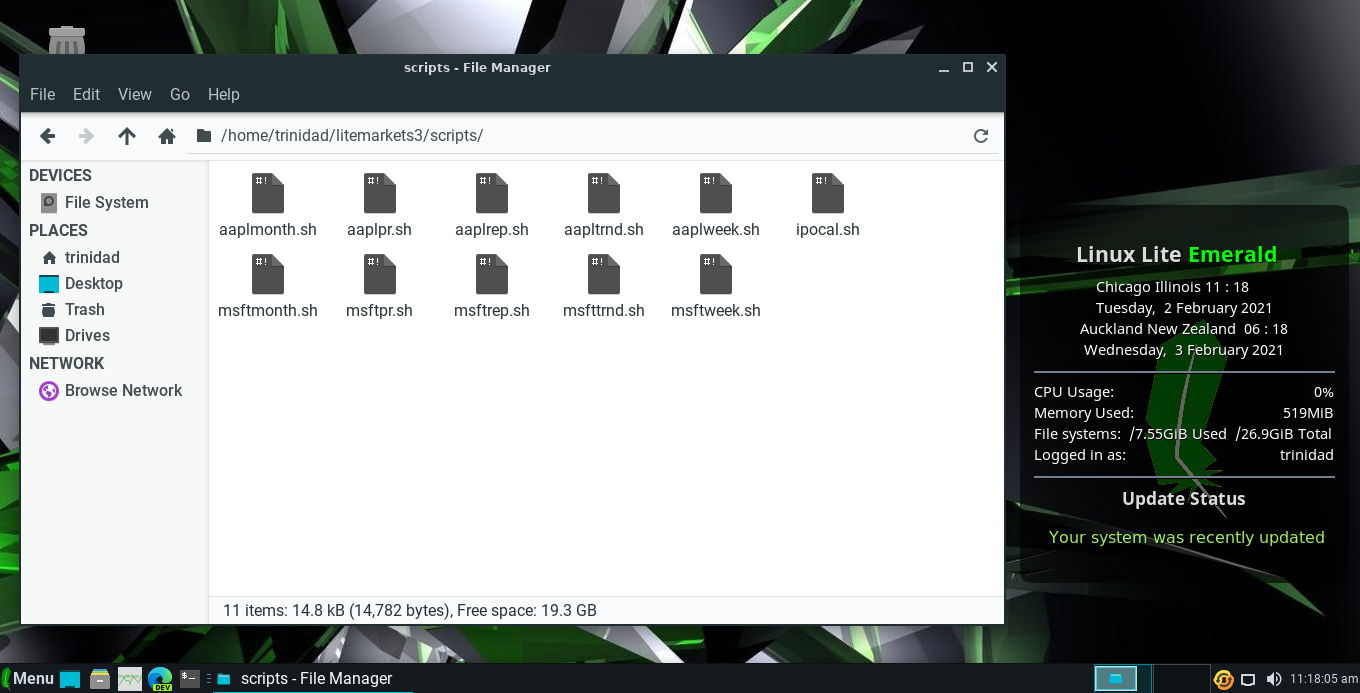
The scripts folder contains all the scripts used to process the applicable data.
Section 2) How To Work With The Plots & Scripts