
Working With Your Scripts & Plots
What follows below are a series of images of the scripts and plots you will get with your download. Before you run them the first time you will need to obtain an API key from the Alpha Vantage web site and insert it in your scripts where you see the entry “TYPEINYOURAPIKEY” which I have typed in blue in these images to make it easier for you to locate in your scripts. To obtain your free API key go to link below.
Get Your Free Alpha Vantage API Key
The API has grown and added many new functions including a wide variety of technical indicators. It is worth researching what you can do now that you have the basic scripts to work with the API. To read through the documentation go to the link below.
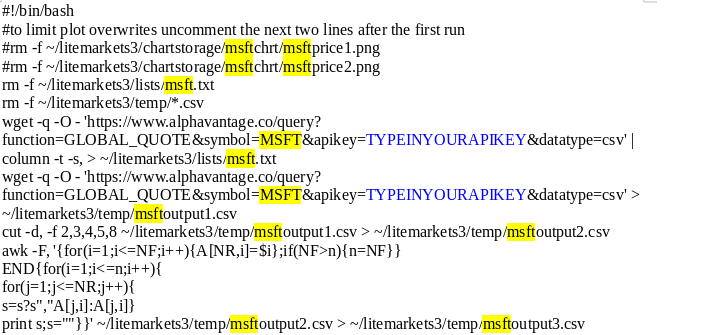
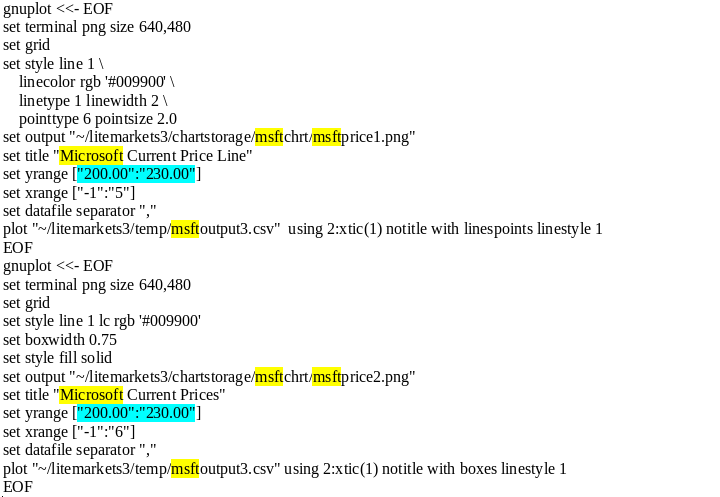
Script #1 Getting A Current Price & Modifying The Data To Plot Two Prices Charts
This script and plot is for the GLOBAL_QUOTE function. It utilizes the data two ways; the first wget provides the current price text that is displayed in the first iframe in your .html interface using the column command; the second wget modifies the data by selecting specific columns (open, high, low, price, previous close) and then uses awk to switch the data and titles from horizontal to vertical to allow easier plotting of the two charts gnuplot will create. I have highlighted in aqua the price range because you will have to make sure that your attempted plot is within the actual range of the data. If your charts come out blank or too low or high just check the price range in your quote lists folder and adjust your plot script accordingly. I’ve highlighted in yellow all the places your specific stock is indicated in commands and the file tree to reference them in case you want to monitor another stock. You can just copy your existing script and change the highlighted values in a text editor and give the new script a new name; for example msftpr.sh would become intcpr.sh if you wanted to monitor Intel. By the way every script here runs and plots in a few seconds, one of the rewards of using wget and gnuplot and a restful API.
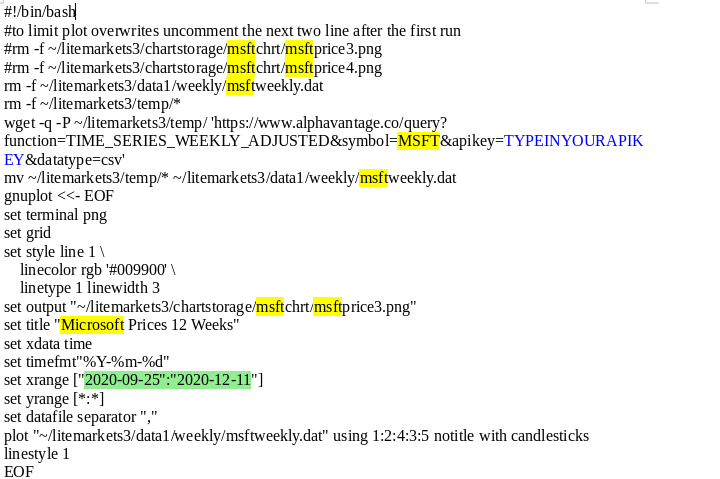
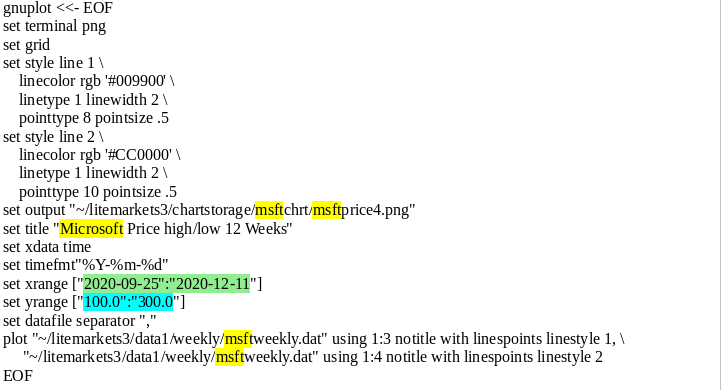
Script #2 Getting Weekly Data & Plotting Weekly Values With Candlesticks & Linespoints High/Low Values
This script obtains weekly data (Friday to Friday) and plots two charts; one candlestick, and one high/low linespoints chart. You will have to adjust the date in the plot scripts as you go, and remember the day is always a Friday. See the area highlighted in green. You will also have to make sure the prices are within your plot price range for the second linespoints chart. See the area highlighted in aqua.
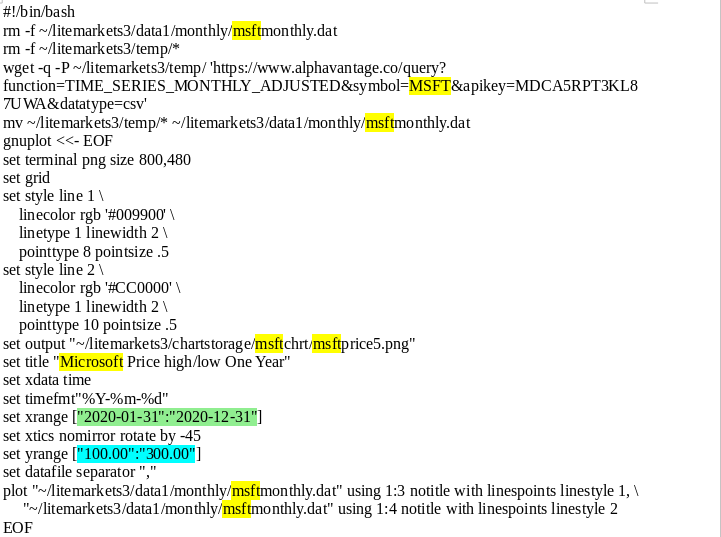
Script #3 Getting Monthly Data & Plotting 1 Year High/Low Linespoints Chart
This script obtains monthly data and plots a one year linespoints high/low chart. It will have to be adjusted month to month. See the area highlighted in green. It will also have to be adjusted for price range. See the area highlighted in aqua.
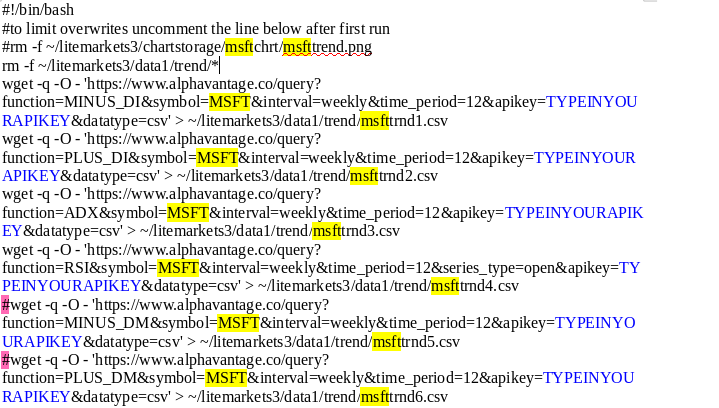
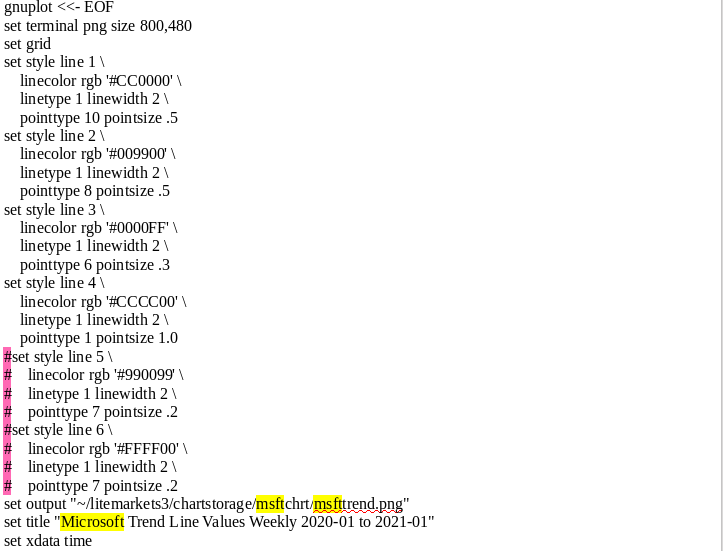
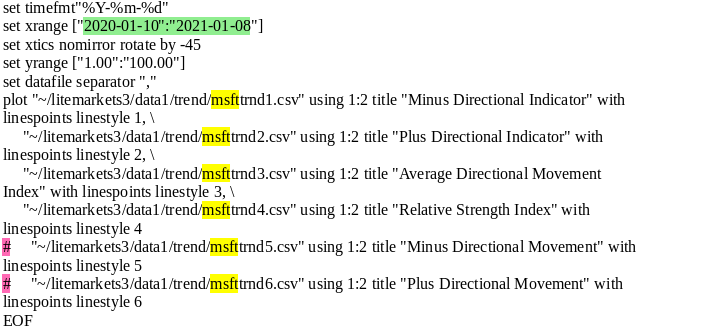
Script #4 Getting Trend Line Data & Plotting Multiple Trend Lines On The Same Chart
This script obtains technical indicator data and plots a linespoints chart. You will notice that I have included six TIs but have commented out two of them. This is just a preference thing to give you the option of using DIs or Dms with your ADX. You can plot them all, which I have done in the past, but with the 5 query per minute limitation at Alpha Vantage I usually comment out the RSI. You will have to adjust the date (by Fridays) as you go along. See the area highlighted in green.
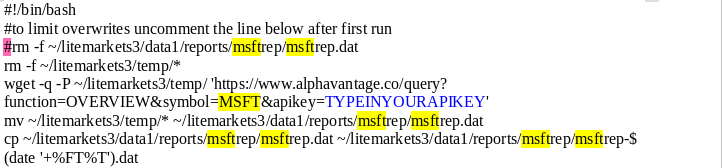
Script #5 Getting & Saving JSON Report Data
Company report data is only available in JSON format, so rather than deal with objects we will just display the JSON file itself as raw data. Company reports are usually quarterly, so you may want to save them for each quarter. To make this simple we just copy and attach a timestamp to the file name itself so that our necessary deletion of the old report shown in our display iframe when obtaining a new report does not discard a copy of the old report in our file folder.
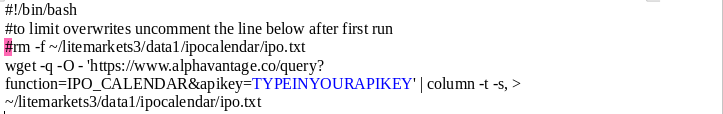
Script #6 Getting IPO Calendar Data
The projected initial public offering calendar is only available in .csv format which suits us just fine. We pipe it to column and save as a nice looking text file to display in our iframe.
As you get familiar with your scripts and interface you should be able to customize what you want to achieve. You now have simple modifiable plots for a candlestick chart, a bar chart, and a few different linespoints charts. You have an easily modifiable display interface written in markup to view your data and charts. If you create a new script for a new security don’t forget to add the folders for them to your file tree before you run them. Assuming you would add Intel you would add: an intcchrt folder to your chartstorage folder, an intcrep folder to your reports folder, and your new scripts should be named following the already in place naming convention, intcpr.sh , intcweek.sh , intcmonth.sh , intctrnd.sh. This will help avoid confusion later, and make the markup page easier to modify.
Return To Section 1) Getting The File Tree Correct
Go To Section 3) How To Work With The Page Code